Welcome to Red Lemur!
Check out some of our projects below! You can also go to our main repository here!
For Programmers (Lemur Data Visualization Package):
Red Lemur (Lemur for short) is a visualization package for multimodal datasets.
Quickstart:
pip3 install redlemur
For more detailed documentation, check the link below!
Exploring the HBN Dataset:
The HBN (Healthy Brain Network) is a rich and robust dataset that collects multiple different modalities of neurological data (EEG and multiple modalities of MRI) for subjects with a variety of phenotypes. With the data it provides, we wanted to explore different levels of correlation/similarities we could find between neuroimaging data and the p factor a metric that can be created from the results of different phenotypic tests. We preprocessed our data using PANDA (EEG) and ndmg (MRI). We calculated this similarity using MGC, an algorithm that categorizes not only global correlation but similarities in local regions.
HBN Site PANDA (EEG) ndmg (MRI)We have preprocessed and calculated similarity with all Resting State EEG and both releases of MRI from the first 3 releases of the HBN Dataset. To access our preprocessed data, you can use Cyberduck and access either public S3 bucket: eegndd/ or mrindd/. Links to our processing scripts and outputs as well as relevant material are below:
Lemur's Automatic Visualization Application (LAVA):
Web service that utilizes Lemur to generate visualizations for its users.
Quickstart (requires both Docker and docker-compose):
Clone our git repository:
git clone https://github.com/NeuroDataDesign/lemur.git
Add your AWS Credentials to the app/dir directory:
cp path/to/your/credentials ./app/credentials/credentials
Go to our app folder:
cd app
docker-compose up
Access the service at localhost:5000! (This link will only work after you have run the service with quickstart instructions)
If you would like to see more detailed documentation on running our webservice or the tools required, check out the links below!
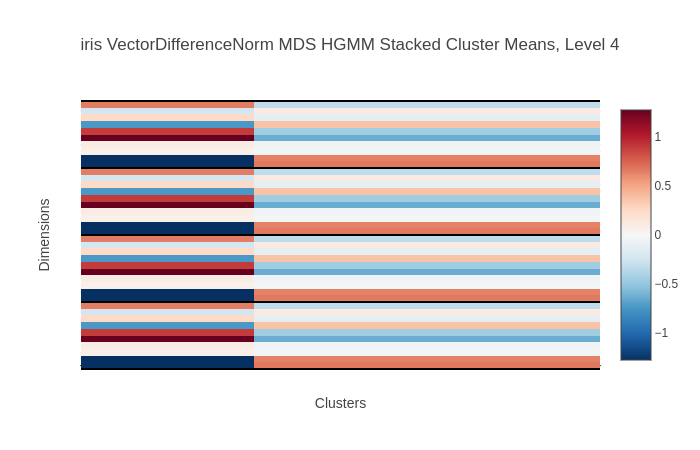
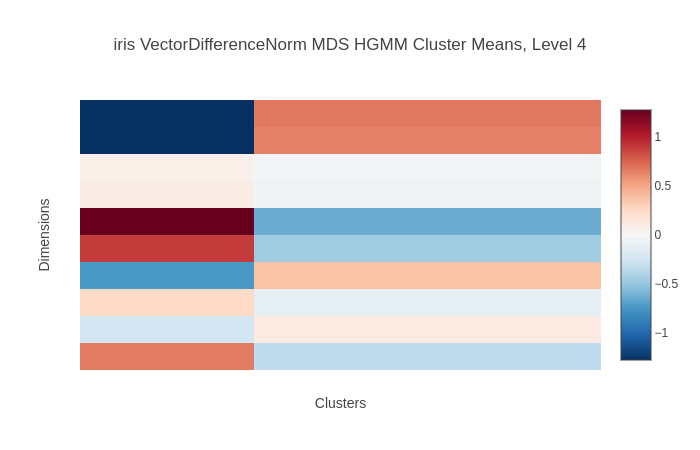
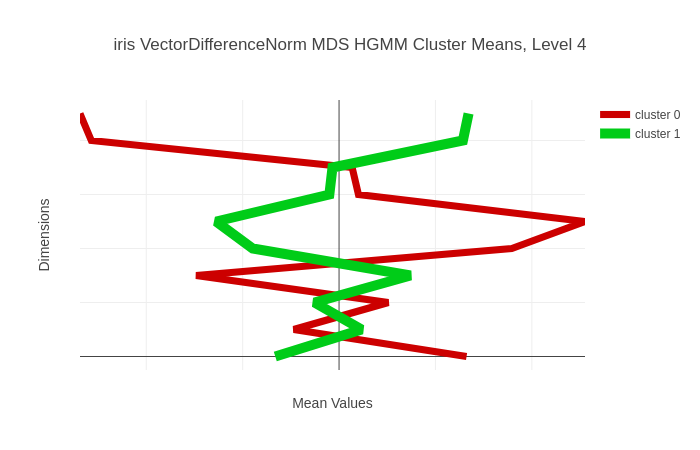
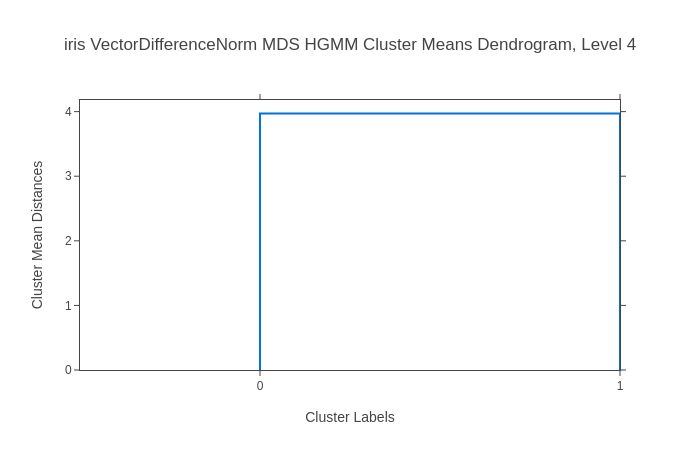
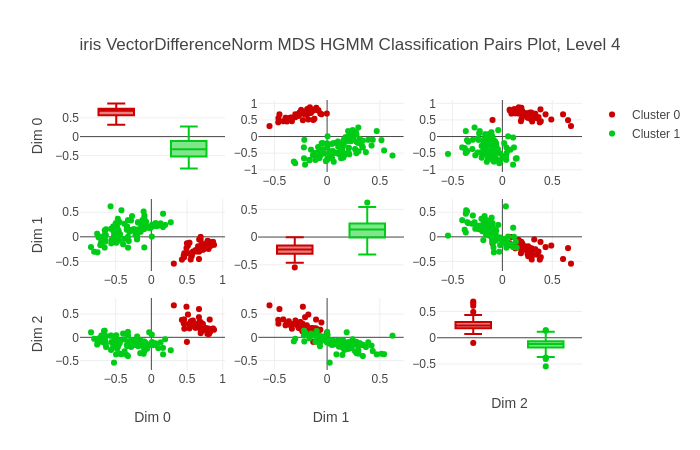
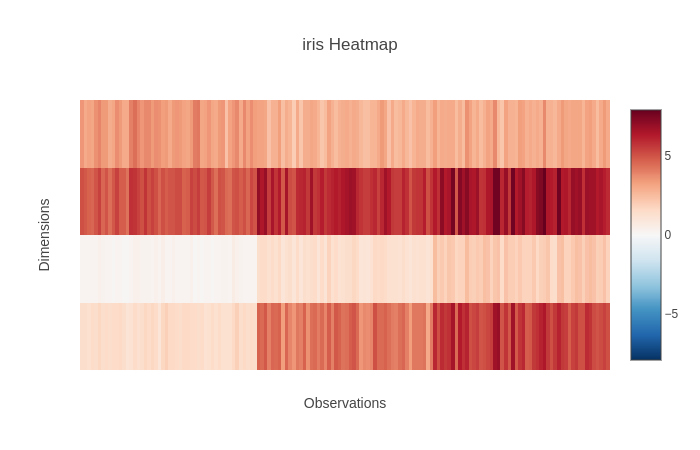
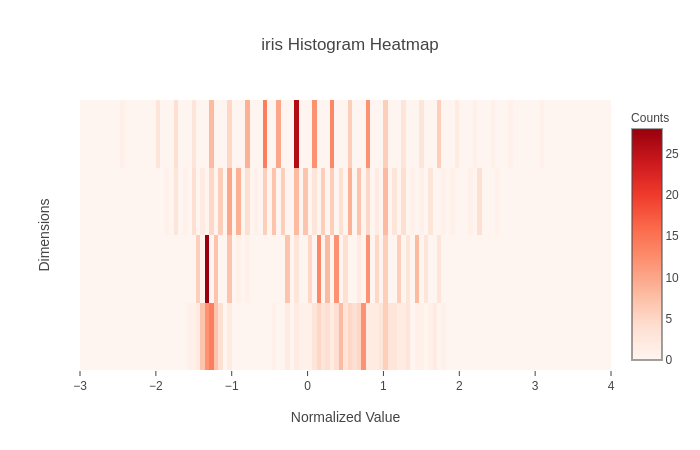
Check out our visualizations!
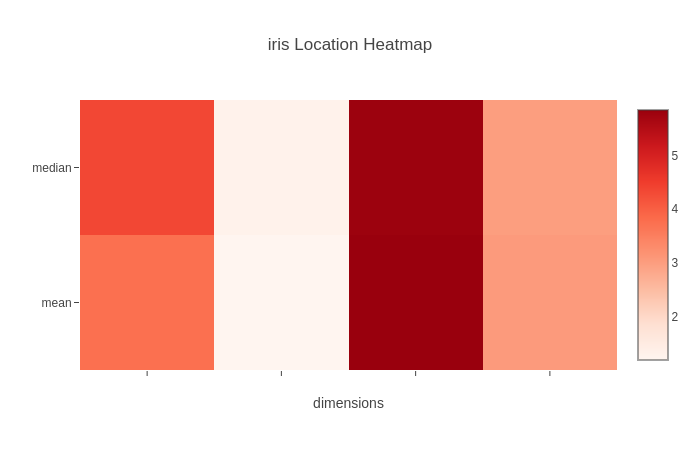
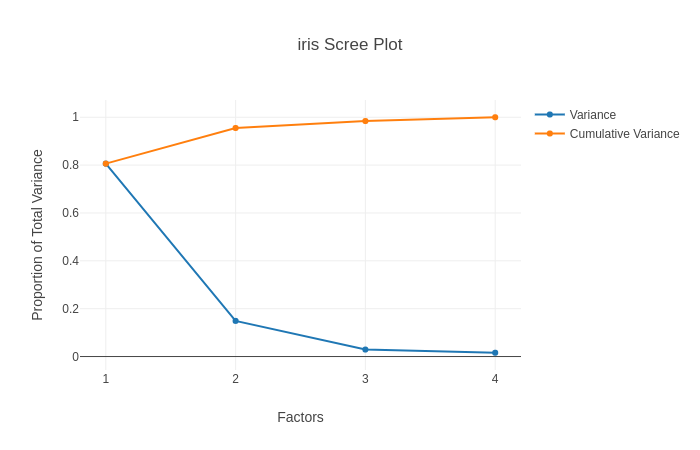
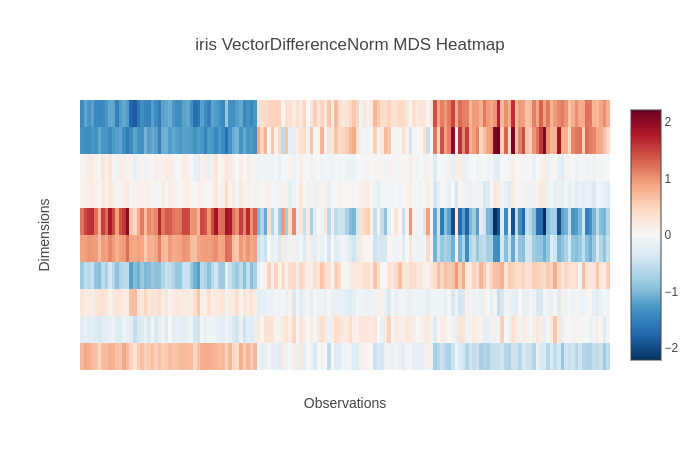
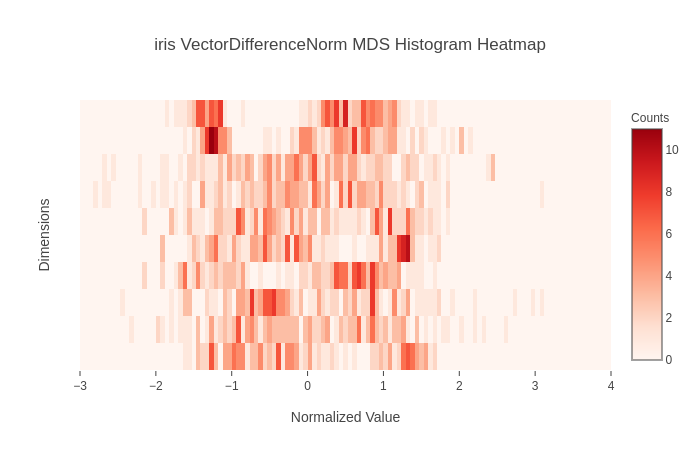
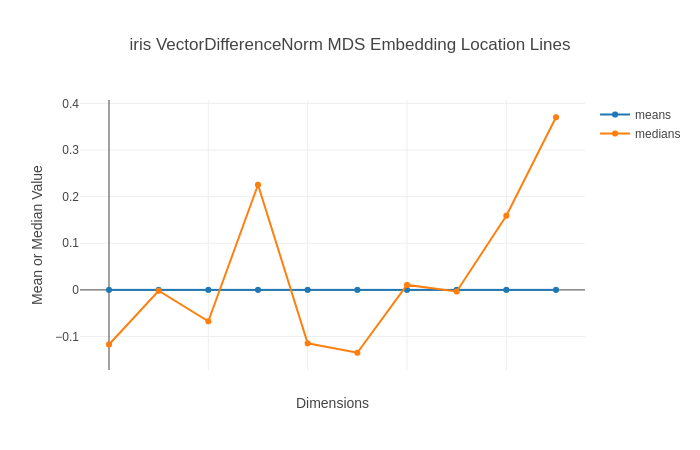
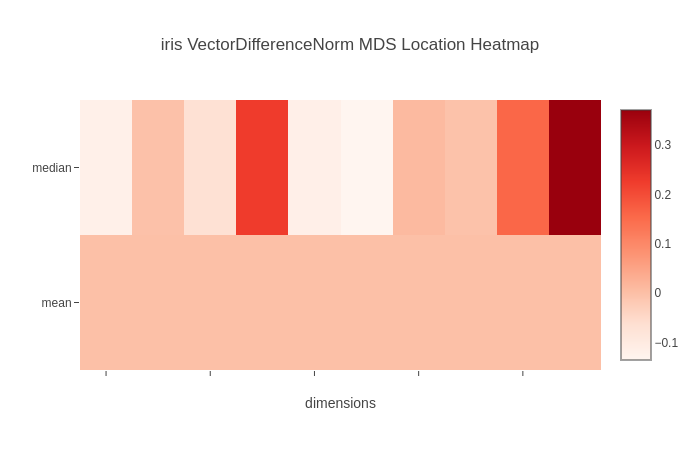
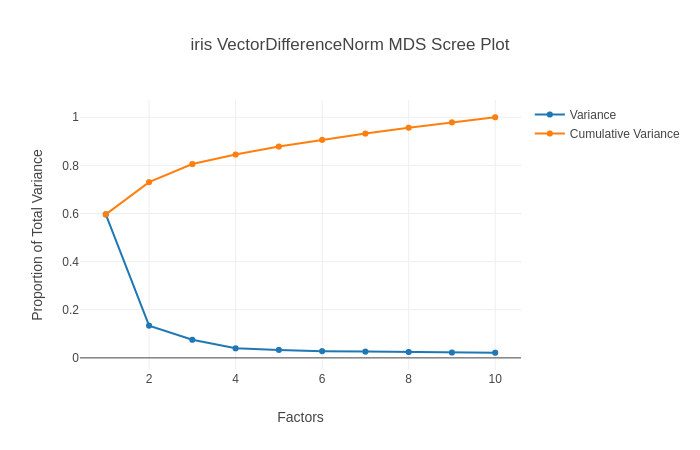
To fully understand the visualizations that the Lemur webservice helps generate, check out some samples below generated with the iris dataset from the Python Pandas package!
Standard Aggregate Plots
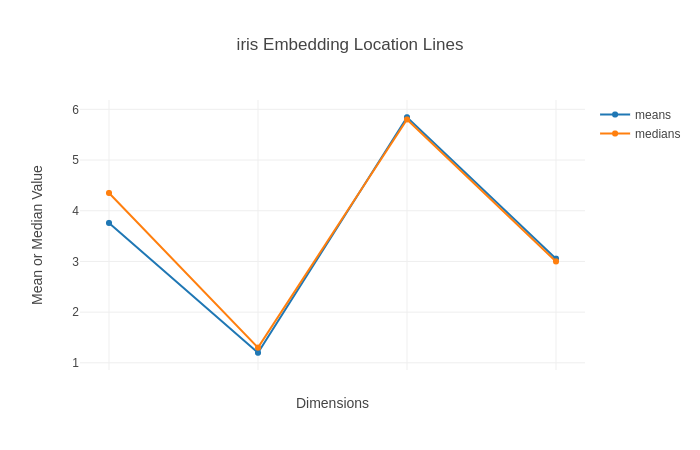
Standard Embedded Plots
Standard Clustered Plots